Mobile Fitness Applications are Changing the Way Planners Understand Active Transportation
Chris Konieczny | January 16, 2020
New technology along with modern trends in fitness activities are changing the way cities plan for active transportation and justify decision making. Using crowdsourced data through mobile and global positioning system (GPS) technology, cities are provided with immediate spatial information, offering a better way to understand and analyze active transit user behaviors and their relation to the built environment. Strava-Metro, a fitness application, has become a popular source for filling the spatial knowledge gap in cycling ridership and pedestrian foot traffic. Applications like this promise to transform the planning of active transportation.
Data Collection has been a Challenge
Prior to GPS and mobile app technology, ridership data was traditionally collected through human observation. This required people to directly observe and document ridership volume and activity. Methods which require workers to actively document volume count offer poor consistency in data and are costly to perform. In addition, research shows observed data is heavily limited by the length of the study and offer minimal spatial detail such as destination points, routes, and distance of travel. Other methods such as permanently installed count stations and temporary counting tubes placed on streets provide greater accuracy during a 24-hour period but still lack the ability to document spatial data. As a result, cities are sometimes forced to use less accurate data to estimate ridership volumes and patterns. Alta Planning + Design, a planning firm in nonmotorized transportation services, reinforces the importance in collecting quality and consistent data:
“Without accurate and consistent count data, it is difficult to measure the positive benefits of investments in these forms of transportation, especially when compared to other modes, such as the private automobile.”
Alta Planning + Design, Innovation in Bicycle and Pedestrian Counts Report, P. 2
The Rise of GPS Mobile Technology
In San Francisco, innovations in ridership count provide for an array of crowdsourcing techniques while doubling as a platform for shared input from the community. Back In 2010, the San Francisco County Transportation Authority, developed CycleTracks, a city-wide GPS mobile application registers cyclists navigation data. With opt in at the discretion of the user, information regarding the rider, route, time, date, and destination is collected to map current activity. CycleTracks was later offered as an open source for other cities to rebrand. Cycle Atlanta for example, added crowdsourcing features for users to upload photos, suggest areas for new amenities, and report concerns regarding their experience. Access to this data information helped urban planners target areas of focus and build a more cohesive representation based on the public’s input.
Many of the benefits to users from fitness apps are provided through features which help target individual fitness goals and tracking of daily fitness. In the long term, the community residents indirectly benefit with the potential for a more improved city landscape and living experience. In addition to publicly-owned applications, planners can connect with private fitness applications with existing data inventories.
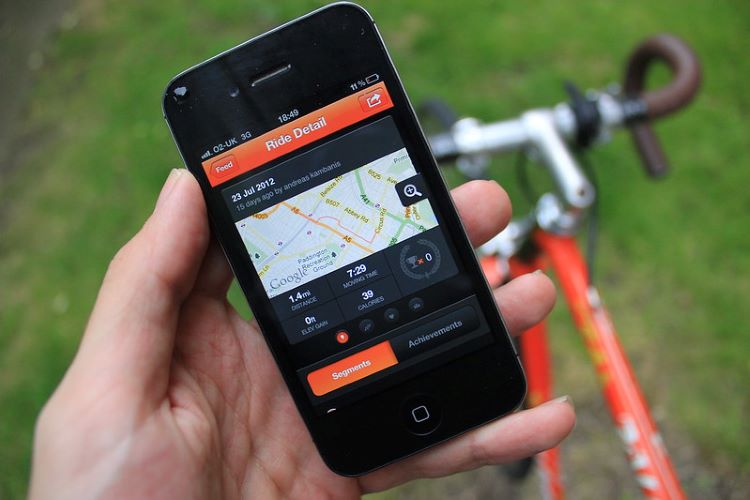
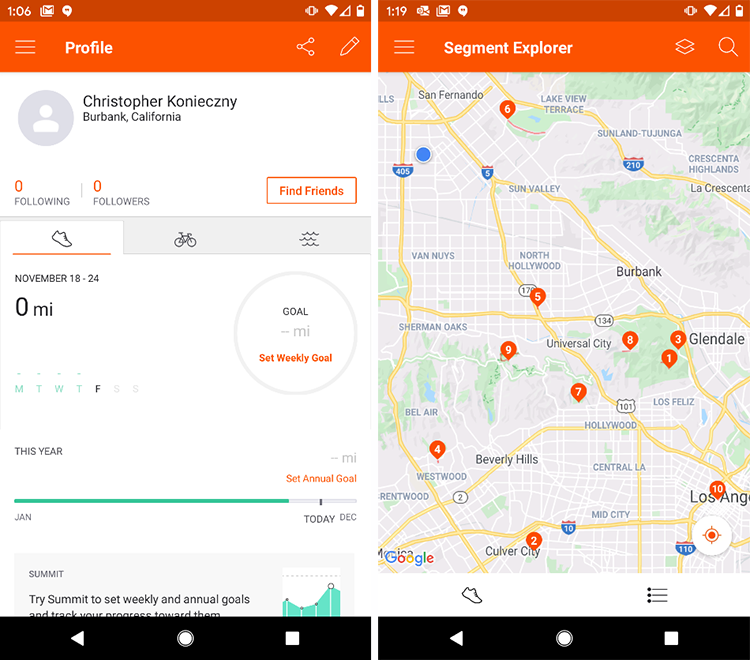
Strava
Trends in fitness along with mobile app technology have helped to spark the introduction of global scale social fitness network application platforms such as Strava-Metro. Compared to other apps such as CycleTracks, much of Strava’s appeal as a source of data collection is based on their market reach and popularity among the fitness community. Although the data must be purchased, ridership activity and behavior provide planners with valuable insight on mobility within various cities, land uses, terrain, and other geographical features. Once accessed, the data can then be studied to highlight trends and patterns as well as to be link to specific characteristics of the built environment such as slope, distance, bicycle facility, traffic speeds, and on-street parking.
Registered user activity varies from city to city. Larger, more populated cities are more likely to have a larger number of active users while smaller cities may not have the same level of representation. In some cases, cities analyze Strava-Metro data in comparison to other data collecting methods. By comparing data from multiple sources, planners can estimate what percentage of cyclists are actively using the app and compare it with areas that lack multiple sources of ridership count data. Neighborhood types and terrain for an example often show varying percentage of active users based on the intent of the trip itself. Highlighted in the Colorado Department of Transportation (CDOT), Strava Metro Data Analysis Summary users were more likely to be active on the app during recreational trips than when traveling to work. CDOT emphasizes that despite the existing flaws in representation, it is still the most abundant source of active transit information available.
Building Evidence-Based Cases
Building case-based evidence for active transit is a challenge for any city when data on ridership volume and activity is not accessible. In Queensland, Australia, Strava-Metro datasets became a significant factor in evaluating the reconstruction of the New Farm Riverwalk, a floating bikeway and walkway. In 2011, floods destroyed the existing pathway connecting the neighborhoods of New Farm and Merthyr to downtown Brisbane. Prior to this event, the bikeway served over 3,000 cyclists and pedestrians each day. As a result, cyclists’ activity along nearby high-speed corridors increased due to the lack of existing bike infrastructure. Strava-Metro data was utilized to compare the increase in activity along these high-speed roads and document cyclist activity once the New Farm Riverwalk was rebuilt in 2014. According to the Queensland State of Cycling Report, the study showed that ridership decreased by 20-30% along high-speed corridors and increased between the two neighborhoods.
In Portland Oregon, data from Strava Metro was purchased to evaluate the Tilikum Crossing Bridge, the country’s first major bridge project banning any crossing of motor vehicles. The city acquired four years’ worth of Strava-Metro data to study trends on how residents were traveling between downtown and nearby destinations across the river. Their research into ridership behaviors showed that cyclists traveled a mile plus in order to cross the river. Connecting the two districts benefited the City of Willamette by encouraging greater participation in active transportation and increasing pedestrian activity between districts.
With millions of registered users in cities worldwide, data from fitness apps are helping to fill in the gaps in active transportation data. By analyzing and comparing the data to already known patterns, cities can better predict the type of riders being recorded, their intent in using active transportation and make future predictions in ridership activity. Looking ahead, technology and crowdsourcing techniques will enable cities to gather more accurate data that better represent their residents’ active transportation needs. Mobile crowdsourced data is a tool for influencing the future of active transportation infrastructure and the way we build for it.

Christopher Konieczny is a graduate student in the Master of Landscape Architecture program at Cal Poly Pomona. His work aims to enrich urban landscapes to better support healthy and sustainable lifestyle opportunities with a strong focus on transit planning.